Financial Report
- Corporate
- Investor
- Financial Report
Financial Summary Table
(in billion Rupiah, unless otherwise stated)
| Income statement | 2024 | 2023 |
|---|---|---|
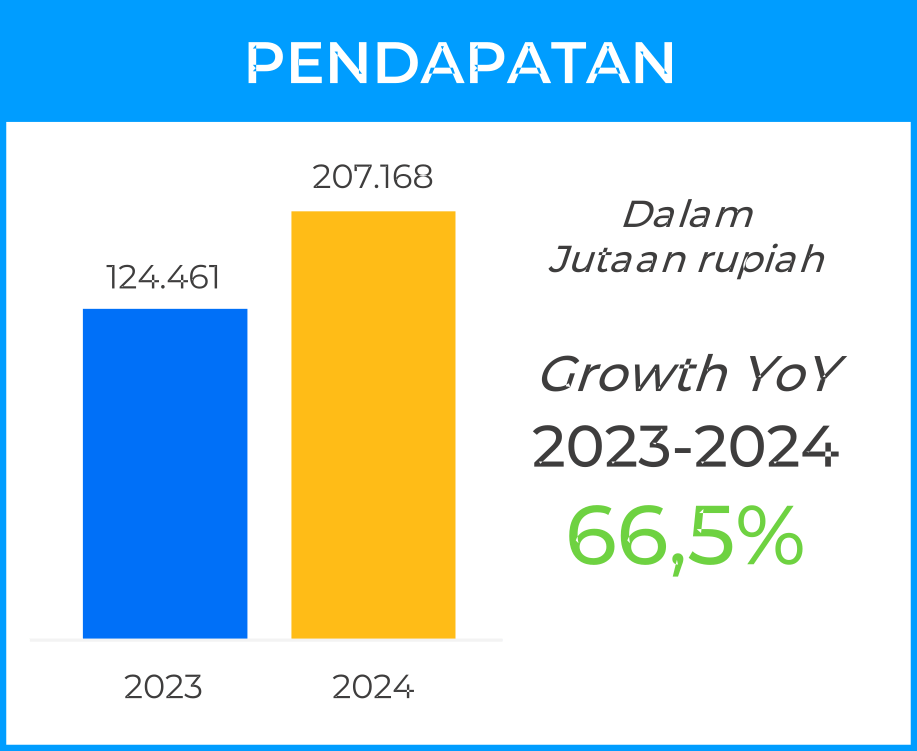
| Income | 207.168 | 124.461 |
| Cost of Goods Sold | (146.005) | (86.153) |
| Gross Profit | 61.162 | 38.307 |
| Profit Before Tax | 34.073 | 14.653 |
| Tax Burden | (3.171) | (1.465) |
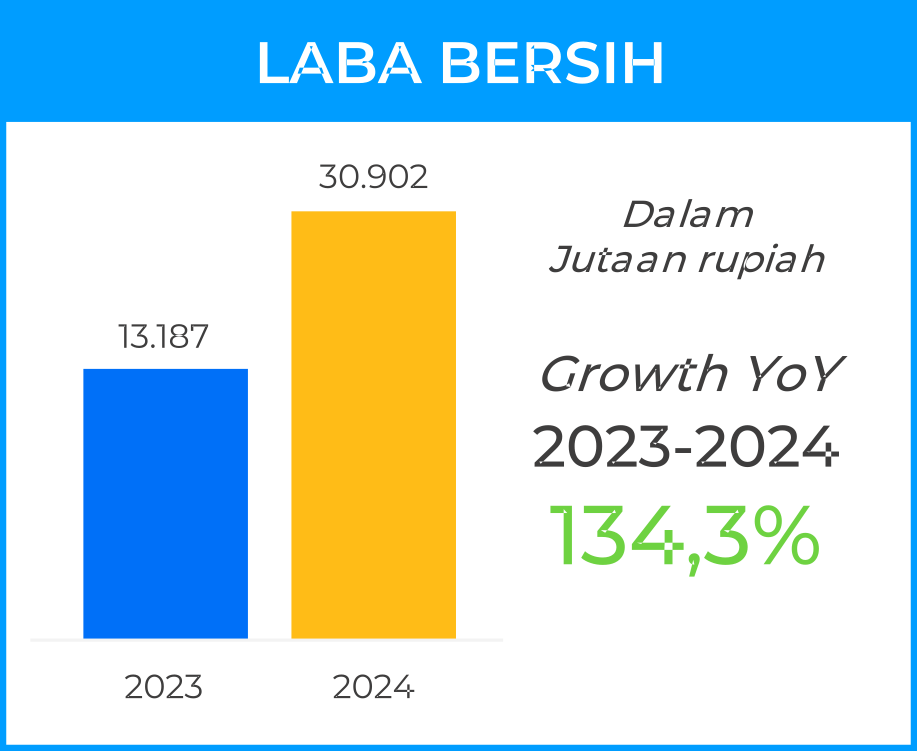
| Current Period Profit | 30.901 | 13.187 |
| Financial Position Statement | 2024 | 2023 |
|---|---|---|
| Total Assets | 239.959 | 189.822 |
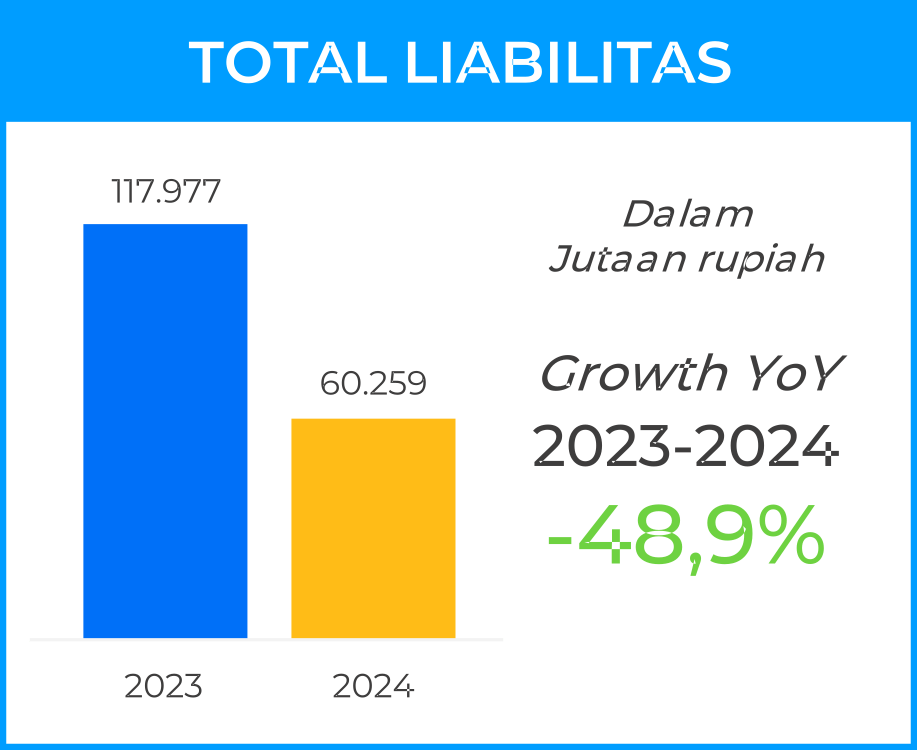
| Total Liabilities | 60.434 | 117.977 |
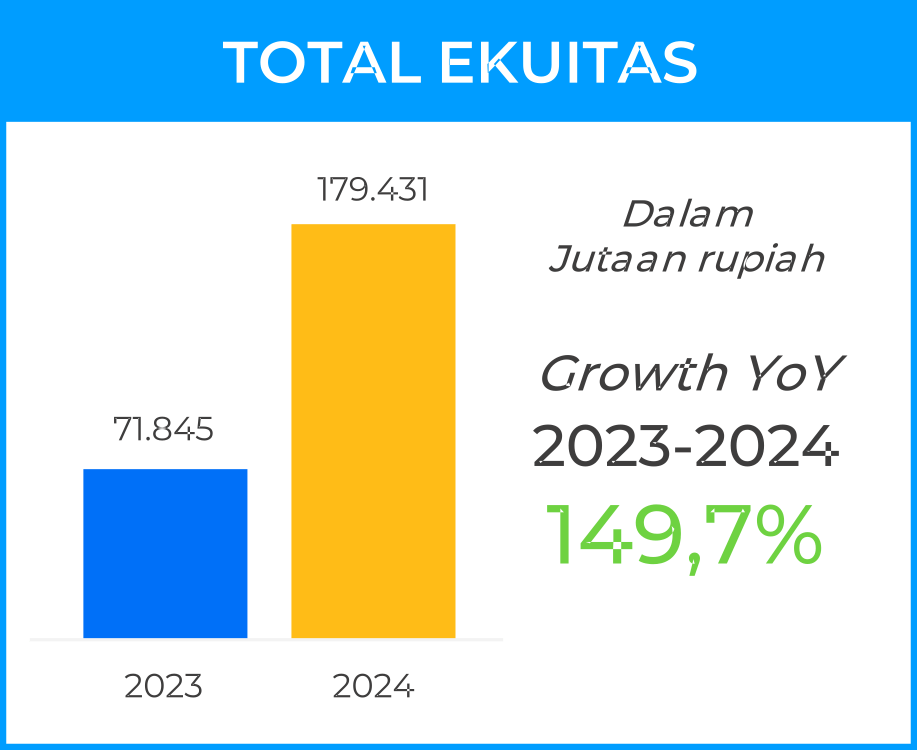
| Total Equity | 179.524 | 71.845 |
| Financial Ratio (%) | 2024 | 2023 |
|---|---|---|
| ROA (%) | 13 | 7 |
| ROE (%) | 17 | 18 |
| NPM (%) | 15 | 11 |
| DER (x) | 0.34 | 1.64 |
| DAR (x) | 0.25 | 0.62 |
Key Financial Data Overview Chart